
Search Exchange
Search All Sites
Nagios Live Webinars
Let our experts show you how Nagios can help your organization.Login
 New Listings
Directory Tree
Directory
nishith
Page 1 of 2
bynishith, July 20, 2023
I'm using it for Network Discovery & want to import the identified nodes & open ports into Nagios Core Configuration, which is not happening.
Kindly Suggest what to do.
nvblue@gmail.com
bynishith, March 15, 2023
This is the most advanced & simple script to achieve the Nagios SSL Expiry Monitoring. Worked Well. Some Nagios Administrators, here is my configuration file.
==========================
commands.cfg
{
define command
command_name check_ssl_cert_expiry
command_line $USER1$/check_ssl_cert_expiry -h $ARG1$ -w $ARG2$ -c $ARG3$
}
==========================
{
define service
use generic-service
check_interval 60
retry_interval 5
host_name central_nagios
service_description Server SSL Certificate Expiry of YOUR DOMAIN NAME check_command check_ssl_cert_expiry!YOUR_DOMAIN_NAME!60!30 contacts nishithvyas notification_interval 60 notifications_enabled 1
}
Done.
==========================
commands.cfg
{
define command
command_name check_ssl_cert_expiry
command_line $USER1$/check_ssl_cert_expiry -h $ARG1$ -w $ARG2$ -c $ARG3$
}
==========================
{
define service
use generic-service
check_interval 60
retry_interval 5
host_name central_nagios
service_description Server SSL Certificate Expiry of YOUR DOMAIN NAME check_command check_ssl_cert_expiry!YOUR_DOMAIN_NAME!60!30 contacts nishithvyas notification_interval 60 notifications_enabled 1
}
Done.
bynishith, March 14, 2023
We might need to compile it first. So, please provide those steps accordingly.
bynishith, March 14, 2023
While execution, if you're getting Shell Interpreter Error, run "sed -i -e 's/\r$//' check_mstat" command.
==================================
Here is my check_mstat file
#!/bin/bash
# Please Change mail.log permissions like (chmod 644 mail.log)
# Implement logrotation on mail.log this file will rotate daily then you have stats of daily basis
#
LOGFILE='/var/log/maillog'
sent=`cat $LOGFILE | grep status=sent | /usr/bin/wc -l`
bounced=`cat $LOGFILE | grep status=bounced | /usr/bin/wc -l`
deferred=`cat $LOGFILE | grep status=deferred | /usr/bin/wc -l`
echo "Total Mails Sent: $sent Bounced: $bounced Deferred: $deferred |Sent="$sent";0;9999999 Bounced="$bounced";0;9999999 Deferred="$deferred";0;9999999"
exit 0
==================================
Here is my postfix.cfg file
define host {
use generic-switch
host_name central_nagios_postfix
address 192.168.1.1
}
#
define hostgroup {
hostgroup_name Postfix
members central_nagios_postfix
}
#
define service {
use generic-service,srv-pnp
host_name central_nagios_postfix
check_interval 5
retry_interval 1
contacts nishith.vyas
service_description Postfix_Mail_Sent
check_command check_postfix_sent_mails
notification_interval 1440
notifications_enabled 1
}
==================================
Here is my commands.cfg file.
define command{
command_name check_postfix_sent_mails
command_line $USER1$/check_mstat
}
==================================
If PNP4Nagios has already been configured, this will start showing graphs also.
Many thanks to the author for making such a nice & simple script.
bynishith, January 11, 2023
The plugin worked properly without any errors. Just you need to install several perl files using "YUM or CPAN".
Upon satisfaction of those prerequisites, you're good to go.
Worked Commands:
./check_nwc_health --hostname 10.10.0.1 --community nnv007 --mode cpu-load
./check_nwc_health --hostname 10.10.0.1 --community nnv007 --mode uptime
./check_nwc_health --hostname 10.10.0.1 --community nnv007 --mode memory-usage
./check_nwc_health --hostname 10.10.0.1 --community nnv007 --mode count-routes
./check_nwc_health --hostname 10.10.0.1 --community nnv007 --mode list-routes
nnv007 is my SNMP v2 Community Name.
My "command.cfg" file.
=================================
define command{
command_name check_cisco_nexus
command_line $USER1$/check_nwc_health --hostname $HOSTADDRESS$ --community $ARG1$ --mode $ARG2$
}
=================================
My "cisco.cfg" file.
define service{
use network-service
host_name cisco-nexus-1,cisco-nexus-2
service_description Check CPU Load
check_command check_cisco_nexus!nnv007!cpu-load
}
=================================
You can replace cpu-load with,
memory-usage
uptime
count-routes
check-config
& Many More...
bynishith, January 9, 2023
==================================
/usr/local/nagios/libexec/check_vpn.pl -H 192.168.1.1 -c nvbLu3@123 -V LIST_ALL_VPNS
request error: The requested table is empty or does not exist at /usr/local/nagios/libexec/check_vpn.pl line 84
==================================
Line No. 84 is:
$result = $session->get_table(-baseoid => $sonicSAStatPeerGateway);
die "request error: ".$session->error unless (defined $result);
Please Revert.
bynishith, December 28, 2022
Worked as described.
Just replaced the below line with the actual one.
#my $file="/var/log/nagios/status.dat"; - old line
my $file="/usr/local/nagios/var/status.dat"; - new line
Run the file & export all data into a text file using ">" sign.
Just replaced the below line with the actual one.
#my $file="/var/log/nagios/status.dat"; - old line
my $file="/usr/local/nagios/var/status.dat"; - new line
Run the file & export all data into a text file using ">" sign.
bynishith, December 23, 2022
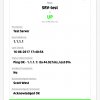
[root@nagios libexec]# ./check_snmp_cisco_wlc_1.5 -H 10.10.0.1 -C public -v 2c --showerror
Total Connected APs are 17
Every AP of 17 APs on WCL is ok.
DataCentre_AP01 is associated (Ok)
SecurityGate_AP02 is associated (Ok)
HR_Cabin_AP03 is associated (Ok)
1st_Floor_AP04 is associated (Ok)
Main_Room_AP05 is associated (Ok)
..... Total 17 APs are showing.
Also, this plug-in generates a "text file" named "10.10.0.1_17" inside "/usr/local/nagios/libexec/" directory that also contains similar information.
This plug-in is really a worth. Also, I'm looking to monitor WLC CPU, Memory, Interface Utilization along with connected users on each AP.
Has anyone identified such kind of plug-in? If yes, please share details on "nvblue@gmail.com".
bynishith, November 16, 2022
Tested on Cisco 9300 & 9500 Switches.
My Command Output is as stated below.
===========================
/usr/local/nagios/libexec/check_snmp_cisco_stack.pl -H 192.168.1.11 -C nnv007 -2
Ring Redundant: yes, Switch States: sw2(sn:FOCXXX)=ready, sw1(sn:FCWXXX)=ready, Port States: up(4),down(0),forcedDown(0) : OK
===========================
192.168.1.11: Switch IP Address.
nnv007: SNMP Community Name.
-2: SNMP Version 2
===========================
bynishith, November 15, 2022
The command is generating proper output. See below.
cd /usr/local/nagios/libexec/
./check_catalyst_load.pl -s 192.168.1.11 -C nishith007 -w 55,65,75 -c 76,85,85
OK: CPU1000: 2% 2% 2% ! CPU2000: 1% 2% 2% !
==========================
Also, you may need to modify the path where the said plugin has been deployed. In my case, the path is "/usr/local/nagios/libexec/" only.
So, change the path like,
use lib "/usr/local/nagios/libexec/";
Save the file & you're good to go.
bynishith, November 15, 2022
This plugin is found working properly. See below command.
===================================
./check_snmp_cisco_memutil.pl -H 192.168.1.11 -C nishith007 -w 75% -c 95% -f
Status is OK - MEMORY: total: 1348.71 MB, used: 257.94 MB (19%), free: 1090.77 MB | MemTotal=1348.71, MemUsed=257.94, MemFree=1090.77
===================================
Here, "nishith007" is the community name & "192.1681.11" is the ciscp switch ip address.
Works with SNMP v1 & v2 both.
===================================
./check_snmp_cisco_memutil.pl -H 192.168.1.11 -C nishith007 -w 75% -c 95% -f
Status is OK - MEMORY: total: 1348.71 MB, used: 257.94 MB (19%), free: 1090.77 MB | MemTotal=1348.71, MemUsed=257.94, MemFree=1090.77
===================================
Here, "nishith007" is the community name & "192.1681.11" is the ciscp switch ip address.
Works with SNMP v1 & v2 both.
bynishith, November 14, 2022
===========================
Below is my commands.cfg file.
define command{
command_name check_cisco_module
command_line $USER1$/check_switch_module -C example123 $HOSTADDRESS$
}
===========================
example123 is my community name
===========================
===========================
Below is my cisco.cfg file configuration
define service {
use generic-service
host_name Cisco2960_1
service_description Check Switch Modules
check_command check_cisco_module
check_interval 60
retry_interval 1
}
===========================
That's it.
bynishith, November 14, 2022
This plug-in gives OK status on any kind of IP Address, which should not happen.
bynishith, November 14, 2022
The said plug-in is found working properly.
bynishith, August 4, 2022
The SNPD Plug-In is working good & you don't need to put too much efforts to configure it. Just follow below steps.
1) Download & Extract the tar file.
2) Put extracted directory into your web application DocumentRoot. In my case, it is Apache "/var/www/html/" directory.
3) You can also change the directory name whatever you want. I've renamed SNPD with NagView. So, my directory path is "/var/www/html/NagView/".
4) Go inside NagView directory & modify conf.php file as per your actual Nagios Configuration.
5) Save & Exit.
Check status on the web browser.
http:///NagView".
That's it.
bynishith, May 3, 2022
The said plug-in works well as mentioned in the description.
Takes less than a minute for installation in Nagios XI.
Takes less than a minute for installation in Nagios XI.
bynishith, October 12, 2021
Even Nagios Linux Shell Command Execution Shows That SMS has been sent but I couldn't see it.
./notify_worldtext_sms.pl -i 33333 -k -d +919879597301 -t Hello From Nagios --sim
The OUTPUT is "Message sent succesfully to +919879597301
", but I don't get it.
AFAIK, if CLI doesn't work, how would the nagios configuraiton works ?
bynishith, June 17, 2021
Just follow the instructions given & you're good to go.
bynishith, October 15, 2020
Finally,
I'm able to install & configure MNTOS on my Linux Machine.
I've integrated total 5 Nagios engines in this & going to improvise the code as per my need. Only you need to focus on 3 main files which are,
nagios.xsl
mntos.php
networks.ini
contacts.ini
nagios-class.php
Now, I'm trying to modify this tool to see all services & hosts in read only mode. Also, will protect this MNTOS URL using htaccess.
No proper document is available over the internet so my goal is to provide it for all Nagios Lovers.
bynishith, June 1, 2020

So, I set the "check_interval" every 1440 minutes. (1 day)
Below is my configuration:
####################START
commands.cfg
define command {
command_name check_file_count
command_line $USER1$/check_file_count.sh $ARG1$ $ARG2$ $ARG3$ $ARG4$
}
####################END
####################sTART
localhost.cfg
define service{
use file-count-service
service_description Nagios Backup Log File Count
check_command check_file_count!/home/Nagios_Backup/!365!400!*.tar.gz
host_name localhost
}
####################END
Description:-
Here, when nagios backup log file count reaches > 365 day, I get WARNING ALERT. It means, I have last 1 year backup files under "/home/Nagios_backup" directory.
CRITICAL Alert is set for 400 days.
SUM UP:
Hope this plugin work with NRPE to monitor my cPanel files.
bynishith, March 5, 2020
Below are the commands:
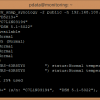
./check_snmp_synology -2 public -h 172.16.1.62 -t disk
Number of disks: 4
"Drive 1" (model: "WD2RX-68EUZN0 ") status:Normal temperature:28
"Drive 2" (model: "WD2RX-68EUZN0 ") status:Normal temperature:29
"Drive 3" (model: "WD2RX-68EUZN0 ") status:Normal temperature:29
"Drive 4" (model: "WD2RX-68EUZN0 ") status:Normal temperature:29
################################
./check_snmp_synology -2 public -h 172.16.1.62 -t temperature
Temperature: 40 (Normal)
OK - Synology is in good health
################################
./check_snmp_synology -2 public -h 172.16.1.62 -t system
Synology model: "DS918+"
Synology s/n: ""
System Status: Normal
OK - Synology is in good health
################################
bynishith, March 4, 2020
##################################
Here is my "commands.cfg" file:
define command{
command_name check_synology_temp
command_line $USER1$/check_snmp_syno.sh -H $HOSTADDRESS$ -C test123 -w 45 -c 50
}
##################################
Here is my "nas.cfg" file:
define service{
use generic-service,srv-pnp
host_name NAS_62
service_description Temperature
check_command check_synology_temp
check_interval 5
retry_interval 1
}
##################################
Command Output:
./check_snmp_syno.sh -H 172.16.1.62 -C n0cgnr -w 45 -c 50
WARNING: 172.16.1.62 has 47 °C
##################################
bynishith, January 1, 2020
Follow this link to testify your nagios configuration. Mine is working aboslutely fine & able to monitor entire IBM Storage with mostly all kind of monitoring parameters.
https://www.bityard.org/blog/2013/12/28/nagios_monitoring_ibm_svc_storwize
https://www.bityard.org/blog/2013/12/28/nagios_monitoring_ibm_svc_storwize
bynishith, December 30, 2019
On the nagios client side, NRPE is giving proper output. But, Nagios Core is showing something else.
On Nagios Clinet (NRPE):
/usr/lib64/nagios/plugins/check_numoffiles.sh -d /var/named/
213 files - ok
NRPE.CFG File Configuration:
command[check_files]=/usr/lib64/nagios/plugins/check_numoffiles.sh -d /var/named/
Error comes in Nagios Core:
/usr/local/nagios/libexec/check_nrpe -H 203.77.200.10 -c check_files
0 files - ok
I don't understand why it is showing -0 files? The plugin is pretty much simple to run.
bynishith, December 30, 2019
Here is the state:
On NRPE (Nagios Client) Server:-
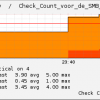
./check_file_count -t=all -s=yes -wt=high -w 250 -c 300 -p=yes /var/named/
OK: Number of files and directories in /var/named/ is 216 (Warn=250, Crit=300) Files=213, Directories=3 | Total=216Count;250;300 Files=213Files 'Directories'=3Directories
From Nagios Core Server:-
./check_nrpe -H 172.16.1.10 -c check_file_count
OK: Number of files and directories in /var/named/ is -1 (Warn=250, Crit=300) Files=0, Directories=-1 | Total=-1Count;250;300 Files=0Files 'Directories'=-1Directories
Something is wrong with the script or call from Nagios Server. May be sudo...!!!
Please Guide.
bynishith, December 30, 2019
Unable to download plugin.... Please provide alternative link.
bynishith, December 30, 2019
I'm using NRPE on Client Side. Below is the configuration.
Upload "check_dirsize11.sh" script on Nagios Client Node under "/usr/lib64/nagios/plugins/" directory.
Open nrpe.cfg file & append new line as follows.
vim /etc/nagios/nrpe.cfg
command[check_syslog_dir]=/usr/lib64/nagios/plugins/check_dirsize11.sh -d /var/log/
Restart NRPE Service.
systemctl restart nrpe
Now on the Nagios Server Side, configure remote host as follows:
define service{
use generic-service
host_name linuxbox1.example.local
service_description SYSLOG Directory Size
check_command check_nrpe!check_syslog_dir
}
Save & Exit.
You can also run the NRPE Command from Nagios Server to get the output. The command is,
/usr/local/nagios/libexec/check_nrpe -H 172.16.1.96 -c check_syslog_dir
Important Note:
If you're getting sudo error to access "DU" command, append below line inside Nagios client sudo file.
%nagios ALL=(ALL) NOPASSWD:ALL
Now, modify "check_dirsize11.sh" plugin, line no:46
DU="/usr/bin/sudo /usr/bin/du"
If you want directory size output in "GB", then change line no. 159 as follows.
duresult=`$DU -sh $dirpath 2>&1` || error="Error"
(Replace -sk with -sh)
That's it.
bynishith, December 30, 2019
Below are the simple steps that I've performed:
1) Downloaded the plugin in "/usr/local/nagios/libexec" directory.
2) chmod +x /usr/local/nagios/libexec/nagios_ntp.sh
3) RUN: /usr/local/nagios/libexec/nagios_ntp.sh
RESULT:
It is giving output as;
NTP OK - Server: 5.103.139.163 Offset: 0.965 Jitter: 0.470; | Offset=0.965ms;10;20 Jitter=0.470ms;;
The plugin works well but would like to know where this IP Address "5.103.139.163" comes from?
I'm from INDIA & local NTP Server is "in.pool.ntp.org" only. I just want to check my NTP Service/Server is listeninig on port 123 or not.
That's it.
Just follow the instructions given by the author & walla....
bynishith, September 17, 2019
This plugin is working well on my HP SAN MSA 2040 Storage.
The CLI Output is:
./check_msa -u nagios -p N@gios123 -h 172.16.1.124
OK: [Vdisk1 (6594.6GB,RAID5,12/) FTOL] [Vdisk2 (9592.2GB,RAID5,5/) FTOL] [CTRLs OK]
##################################
It gives perfect information of,
Total Disk Space
RAID Configured
No of. Disks allotted.
##################################
Here is the commands.cfg file:
define command{
command_name check_msa_2040
command_line $USER1$/check_msa -u nagios -p N@gios123 -h 172.16.1.124
}
#################################
Here is the san.cfg file:
define service{
use generic-service
host_name HP-MSA2040_SP1
service_description Vdisks_RAID_Space_Info
check_command check_msa_2040
check_interval 30
retry_interval 1
}
#################################
But, Nagios Frontend is still giving Net/Telnet.pm & Net/XML.pm error.
Strange thing is, I've already installed both missing plugins thru. CPAN...!!!
Can anyone help?
bynishith, September 17, 2019
Below is the command:
# ./check_hp_msa2000_vdisks.pl -H 172.16.1.124 -u nagios -p N@gios123 -d Vdisk1
OUTPUT:-
Vdisk1 is online.
############################
commands.cfg file:-
define command{
command_name check_hp_msa_2040_vdisks
command_line $USER1$/check_hp_msa2000_vdisks.pl -H 172.16.1.124 -u $ARG1$ -p $ARG2$ -d $ARG3$
}
############################
san.cfg file
define service{
use generic-service
host_name HP-MSA2040_SP1
service_description Vdisk1 Status
check_command check_hp_msa_2040_vdisks!nagios!N@gios123!Vdisk1
check_interval 15
retry_interval 1
}
##############################
bynishith, October 23, 2018
Configured this plugin to monitor Hitachi HDS VSP G200 SAN Storage.
Below is the output:
./check_hitachi.sh -H 192.168.1.254 -C common
OK - [Model : UNKNOWN, S/N : XXXXXX, Mcode info : "21-01-76-40/00"]
OK - Status is NORMAL [DKC_HW_PROCESSOR]
OK - Status is NORMAL [DKC_HW_CACHE]
OK - Status is NORMAL [DKC_HW_POWERSUPPLY]
OK - Status is NORMAL [DKC_HW_BATTERY]
OK - Status is NORMAL [DKC_HW_FAN]
OK - Status is NORMAL [DKU_HW_POWERSUPPLY]
OK - Status is NORMAL [DKU_HW_FAN]
OK - Status is NORMAL [DKU_HW_Drive]
bynishith, December 1, 2017
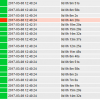
[root@linuxbox3 libexec]# ./check_snmp_uptime -H linuxbox2.example.local -C public -w 30 -c 50
The uptime is 6 hours and 21 minutes | uptime=0;30;50;0
bynishith, September 21, 2017
####Nagios Server####
define service{
use generic-service
host_name mail.example.local
service_description eth0 Network
check_command check_nrpe!eth0_network
check_interval 1
}
####NRPE Client####
vim /usr/local/nagios/etc/nrpe.cfg
command[eth0_network]=/usr/local/nagios/libexec/check_network.py eth0
#############################
-Nishith N.Vyas
bynishith, September 21, 2017
Very Simple to use with NRPE. :)
###########################
Nagios Server Configuration:
define service{
use generic-service
host_name mail.example.local
service_description KERNEL Version
check_command check_nrpe!check_kernel
check_interval 1440
}
###########################
NRPE File Configuration:
vim /usr/local/nagios/etc/nrpe.cfg
command[check_kernel]=/usr/local/nagios/libexec/check_kernel
###########################
-Nishith N.Vyas
###########################
Nagios Server Configuration:
define service{
use generic-service
host_name mail.example.local
service_description KERNEL Version
check_command check_nrpe!check_kernel
check_interval 1440
}
###########################
NRPE File Configuration:
vim /usr/local/nagios/etc/nrpe.cfg
command[check_kernel]=/usr/local/nagios/libexec/check_kernel
###########################
-Nishith N.Vyas
bynishith, September 20, 2017
Here is my NRPE Output:
####NRPE Command####
# /usr/local/nagios/libexec/check_disk -w 80 -c 90 -d /dev/cciss/c0d0p1
OK - /dev/cciss/c0d0p1 space used=79% | '/dev/cciss/c0d0p1 usage'=79%;80;90;
###NRPE Config in /usr/local/nagios/etc/nrpe.cfg file###
command[check_root]=/usr/local/nagios/libexec/check_disk -w 80 -c 90 -d /dev/cciss/c0d0p1
###NAGIOS SERVER CONFIG###
define service{
use generic-service
host_name test.example.local
service_description ROOT Partition
check_command check_nrpe!check_root
check_interval 15
retry_interval 1
}
bynishith, September 20, 2017
My cPanel is under 3 year license but this script is showing "License Inactive" message...!! :(
The URL mentioned inside this script seems proper as below,
http://verify.cpanel.net/index.cgi?ip=%s
Nishith N.Vyas
The URL mentioned inside this script seems proper as below,
http://verify.cpanel.net/index.cgi?ip=%s
Nishith N.Vyas
bynishith, September 19, 2017
[root@support libexec]$ ./check_snmp_traffic 172.16.1.8 public 1 ">200" ">400"
Traffic OK - .01 Mb/s in Sum|traffic=.01;>200;>400;0; In=.01;;;0; Out=0;;;0;
OUTPUT IS:-
IF-MIB::ifName.1 = STRING: Vl1
IF-MIB::ifName.5049 = STRING: Lo0
IF-MIB::ifName.10101 = STRING: Gi0/1
IF-MIB::ifName.10102 = STRING: Gi0/2
IF-MIB::ifName.10103 = STRING: Gi0/3
IF-MIB::ifName.10104 = STRING: Gi0/4
IF-MIB::ifName.10105 = STRING: Gi0/5
IF-MIB::ifName.10106 = STRING: Gi0/6
IF-MIB::ifName.10107 = STRING: Gi0/7
IF-MIB::ifName.10108 = STRING: Gi0/8
IF-MIB::ifName.10109 = STRING: Gi0/9
IF-MIB::ifName.10110 = STRING: Gi0/10
IF-MIB::ifName.10111 = STRING: Gi0/11
IF-MIB::ifName.10112 = STRING: Gi0/12
IF-MIB::ifName.10113 = STRING: Gi0/13
IF-MIB::ifName.10114 = STRING: Gi0/14
IF-MIB::ifName.10115 = STRING: Gi0/15
IF-MIB::ifName.10116 = STRING: Gi0/16
IF-MIB::ifName.10117 = STRING: Gi0/17
IF-MIB::ifName.10118 = STRING: Gi0/18
IF-MIB::ifName.10119 = STRING: Gi0/19
IF-MIB::ifName.10120 = STRING: Gi0/20
IF-MIB::ifName.10121 = STRING: Gi0/21
IF-MIB::ifName.10122 = STRING: Gi0/22
IF-MIB::ifName.10123 = STRING: Gi0/23
IF-MIB::ifName.10124 = STRING: Gi0/24
IF-MIB::ifName.10125 = STRING: Gi0/25
IF-MIB::ifName.10126 = STRING: Gi0/26
IF-MIB::ifName.10127 = STRING: Gi0/27
IF-MIB::ifName.10128 = STRING: Gi0/28
But, monitoring Gi0/24 interface gives below error.
[root@support libexec]$ ./check_snmp_traffic 172.16.1.8 public 24 ">200" ">400"
./check_snmp_traffic: line 93: [: Such: integer expression expected
./check_snmp_traffic: line 96: [: Such: integer expression expected
./check_snmp_traffic: line 105: [: Such: integer expression expected
./check_snmp_traffic: line 108: [: Such: integer expression expected
(standard_in) 1: illegal character: S
(standard_in) 1: syntax error
./check_snmp_traffic: line 151: [: -eq: unary operator expected
./check_snmp_traffic: line 154: [: -eq: unary operator expected
./check_snmp_traffic: line 157: [: too many arguments
Traffic UNKNOWN - Mb/s in Sum|traffic=;>200;>400;0; In=;;;0; Out=;;;0;
I need a common plugin thru which I can monitor all SNMP enabled network devices graph i.e. CIsoc, Fortigate, Juniper, Windows & Linux OSes.
bynishith, September 10, 2017
Here is my commands.cfg file:
check_website -H $HOSTADDRESS$ $ARG1$
My service Monitoring Command is,
check_website "www.example.com/login.aspx"
It gives HTTP OK Message in Nagios Web Frontend.
check_website -H $HOSTADDRESS$ $ARG1$
My service Monitoring Command is,
check_website "www.example.com/login.aspx"
It gives HTTP OK Message in Nagios Web Frontend.
bynishith, July 28, 2016
This plugin worked well on VNX 5300 SAN Storage. Below is my configuration.
Used below RPM on CentOS 7:
UnisphereCLI-Linux-64-x86-en_US-3.0.0.1.16-1.x86_64.rpm
#################################################
Command Output:
./check_emc_clariion_vnx.pl -H 10.0.0.1 -u sysadmin -p password -t lun --lun_id 0
OK {State:Bound} {ID:0} {Name:Application} {Size:500.00GB} {Free Space:0.00B = 0%} {RAID Group Type:N/A, N/A} {Percentage Rebuilt:100%}|'Size'=500.00GB;;;; 'Free Space'=0.00B;;;; 'Free Space Percentage'=0%;;;;
#################################################
/usr/local/nagios/libexec/check_emc_clariion_vnx.pl -H 10.0.0.1 -u sysadmin -p password -t disk
15 physical disks are OK. 1 Hotspares are ready. 0 Unbound. Probably for HotSpare.
#################################################
Able to monitor below services:
Individual LUN Info
Raid Group Info (RAID 1 and RAID 5)
Service Processor Status
Faults
Thanks,
Nishith N.Vyas
Below are the perfect steps:
* cd /tmp
* git clone git://git.code.sf.net/p/nagios/nagiosbpi nagios-nagiosbpi
* cd nagios-nagiosbpi
* cp -R nagiosbpi /usr/local/nagios/share
* *cd /usr/local/nagios/share/nagiosbpi
* mkdir /usr/local/nagios/share/nagiosbpi/tmp
* chmod o+rx config_functions functions images tmp
* chmod o+rxw tmp
* chmod +x set_bpi_perms.sh
Edit "/usr/local/nagios/share/nagiosbpi/constants.conf" as below:
CONFIGFILE= /usr/local/nagios/share/nagiosbpi/bpi.conf
CONFIGBACKUP=/usr/local/nagios/share/nagiosbpi/tmp/bpi.conf.backup
##optional xml output of BPI group data. USE ABSOLUTE DIRECTORIES FOR ALL FILE LOCATIONS
XMLOUTPUT=/usr/local/nagios/share/nagiosbpi/tmp/bpi.xml
Finally, open NagiosBPI:
http://Nagios_IP/nagios/nagiosbpi
Enjoy....!!!
bynishith, July 27, 2016

https://exchange.nagios.org/directory/Addons/Components/Nagios-Business-Process-Intelligence-(BPI)/details
bynishith, July 26, 2016

It changes entire look of traditional nagios interface, which most people do not like.
bynishith, June 6, 2016
Need to improve this plugin. Below is my output.
./check_windows_update.pl -H 10.0.77.10 public
Use of uninitialized value $opt_p in concatenation (.) or string at ./check_windows_update.pl line 69.
snmpwalk: Unknown host (HOST-RESOURCES-MIB::hrSWRunName) (No such file or directory)
Thanks,
Nishith
./check_windows_update.pl -H 10.0.77.10 public
Use of uninitialized value $opt_p in concatenation (.) or string at ./check_windows_update.pl line 69.
snmpwalk: Unknown host (HOST-RESOURCES-MIB::hrSWRunName) (No such file or directory)
Thanks,
Nishith
bynishith, June 6, 2016
Dell PowerEdge 2950
Dell R510
Dell R710
Dell PowerEdge 1900
Command Output is:
##########################################
./check_snmp_dell_poweredge -H 10.0.77.43 -C public -t redundancy
Power supply redundancy is OK
./check_snmp_dell_poweredge -H 10.0.77.43 -C public -t temperature
Ambient temperature : 15 Degres Celsius | temperature=15;0;0;0
./check_snmp_dell_poweredge -H 10.0.77.43 -C public -t health
Etat general : Warning
./check_snmp_dell_poweredge -H 10.0.77.43 -C public -t info
Information : Dell PowerEdge 2950 possede le service TAG '8B1PX1S'
./check_snmp_dell_poweredge -H 10.0.77.43 -C public -t disk -d 2
Disk Status 'Physical Disk 0:0:1' : Online, RAID array is OK
Will work with all Disks, Just change the Disk ID in the end
##########################################
My commands.cfg file:
define command{
command_name check_snmp_dell_poweredge_temp
command_line $USER1$/check_snmp_dell_poweredge -H $HOSTADDRESS$ -C $ARG1$ -t $ARG2$ -w $ARG3$ -c $ARG4$
}
define command{
command_name check_snmp_dell_poweredge_disk
command_line $USER1$/check_snmp_dell_poweredge -H $HOSTADDRESS$ -C $ARG1$ -t $ARG2$ -d $ARG3$
}
define command{
command_name check_snmp_dell_poweredge
command_line $USER1$/check_snmp_dell_poweredge -H $HOSTADDRESS$ -C $ARG1$ -t $ARG2$
}
########################################
Thanks to the author... I'm first to put +ve review....ha ha ha...!!!
bynishith, June 3, 2016
Simple Execution of this plugins provides below output:
./check_FCBrocade_hardware.sh -H 10.0.77.4 -c Secret-C0de
HARDWARE OK : SLOT#0TEMP#1=22C, SLOT#0TEMP#2=22C, SLOT#0TEMP#3=24C, FAN#1=5769RPM, FAN#2=5769RPM, FAN#3=5769RPM, PowerSupply#1=1,|22;22;24;5769;5769;5769;1;
Still in process to make it functional properly in nagios config file.
./check_FCBrocade_hardware.sh -H 10.0.77.4 -c Secret-C0de
HARDWARE OK : SLOT#0TEMP#1=22C, SLOT#0TEMP#2=22C, SLOT#0TEMP#3=24C, FAN#1=5769RPM, FAN#2=5769RPM, FAN#3=5769RPM, PowerSupply#1=1,|22;22;24;5769;5769;5769;1;
Still in process to make it functional properly in nagios config file.
bynishith, June 1, 2016
Below is the output of command line:
./check_snmp_memory.pl -w 85 -c 90 public 10.0.77.10
SNMP problem - no value returned
./check_snmp_memory.pl -w 85 -c 90 -- -c public 10.0.77.10
SNMP problem - no value returned
./check_snmp_memory.pl -w 85 -c 90 -- -c public 10.0.77.10
SNMP problem - no value returned
No Luck...
./check_snmp_memory.pl -w 85 -c 90 public 10.0.77.10
SNMP problem - no value returned
./check_snmp_memory.pl -w 85 -c 90 -- -c public 10.0.77.10
SNMP problem - no value returned
./check_snmp_memory.pl -w 85 -c 90 -- -c public 10.0.77.10
SNMP problem - no value returned
No Luck...
I have used below command to get "Windows Interfaces".
./check_traffic.sh -V 1 -C nocgnr -H 172.16.1.105 -L
List Interface for host 172.16.1.105.
Interface index 1 orresponding to Software Loopback Interface 1.
Interface index 2 orresponding to WAN Miniport (SSTP).
Interface index 3 orresponding to WAN Miniport (L2TP).
Interface index 4 orresponding to WAN Miniport (PPTP).
Interface index 5 orresponding to WAN Miniport (PPPOE).
Interface index 6 orresponding to WAN Miniport (IPv6).
Interface index 7 orresponding to WAN Miniport (Network Monitor).
Interface index 8 orresponding to WAN Miniport (IP).
Interface index 9 orresponding to RAS Async Adapter.
Interface index 10 orresponding to WAN Miniport (IKEv2).
Interface index 11 orresponding to QLogic BCM57840 10 Gigabit Ethernet (NDIS VBD Client) #128.
Interface index 12 orresponding to Microsoft ISATAP Adapter.
Interface index 13 orresponding to QLogic BCM57840 10 Gigabit Ethernet (NDIS VBD Client) #131.
Interface index 14 orresponding to Microsoft ISATAP Adapter #2.
Interface index 15 orresponding to QLogic BCM57840 10 Gigabit Ethernet (NDIS VBD Client) #130.
Interface index 16 orresponding to QLogic BCM57840 10 Gigabit Ethernet (NDIS VBD Client) #135.
Interface index 17 orresponding to Microsoft ISATAP Adapter #3.
Interface index 18 orresponding to Microsoft ISATAP Adapter #4.
Interface index 19 orresponding to Microsoft 6to4 Adapter.
Interface index 20 orresponding to QLogic BCM57840 10 Gigabit Ethernet (NDIS VBD Client) #131-Trend Micro NDIS 6.0 Filter driver-0000.
Interface index 21 orresponding to QLogic BCM57840 10 Gigabit Ethernet (NDIS VBD Client) #128-QoS Packet Scheduler-0000.
Interface index 22 orresponding to QLogic BCM57840 10 Gigabit Ethernet (NDIS VBD Client) #128-WFP LightWeight Filter-0000.
Interface index 23 orresponding to QLogic BCM57840 10 Gigabit Ethernet (NDIS VBD Client) #131-QoS Packet Scheduler-0000.
Interface index 24 orresponding to QLogic BCM57840 10 Gigabit Ethernet (NDIS VBD Client) #131-WFP LightWeight Filter-0000.
Interface index 25 orresponding to QLogic BCM57840 10 Gigabit Ethernet (NDIS VBD Client) #130-Trend Micro NDIS 6.0 Filter driver-0000.
Interface index 26 orresponding to WAN Miniport (Network Monitor)-Trend Micro NDIS 6.0 Filter driver-0000.
Interface index 27 orresponding to QLogic BCM57840 10 Gigabit Ethernet (NDIS VBD Client) #130-QoS Packet Scheduler-0000.
Interface index 28 orresponding to QLogic BCM57840 10 Gigabit Ethernet (NDIS VBD Client) #130-WFP LightWeight Filter-0000.
Interface index 29 orresponding to WAN Miniport (IPv6)-Trend Micro NDIS 6.0 Filter driver-0000.
Interface index 30 orresponding to QLogic BCM57840 10 Gigabit Ethernet (NDIS VBD Client) #135-Trend Micro NDIS 6.0 Filter driver-0000.
Interface index 31 orresponding to QLogic BCM57840 10 Gigabit Ethernet (NDIS VBD Client) #135-QoS Packet Scheduler-0000.
Interface index 32 orresponding to QLogic BCM57840 10 Gigabit Ethernet (NDIS VBD Client) #135-WFP LightWeight Filter-0000.
Interface index 33 orresponding to WAN Miniport (Network Monitor)-QoS Packet Scheduler-0000.
Interface index 34 orresponding to QLogic BCM57840 10 Gigabit Ethernet (NDIS VBD Client) #128-Trend Micro NDIS 6.0 Filter driver-0000.
Interface index 35 orresponding to WAN Miniport (IP)-QoS Packet Scheduler-0000.
Interface index 36 orresponding to WAN Miniport (IP)-Trend Micro NDIS 6.0 Filter driver-0000.
Interface index 37 orresponding to WAN Miniport (IPv6)-QoS Packet Scheduler-0000.
But, don't know which "Interface Index" I need to mention in command line to generate output.
The error is,
./check_traffic.sh -V 1 -C nocgnr -H 172.16.1.105 -N "Interface index 20"
Can not get the interface index with Interface index 20 at 172.16.1.105.
Same error for Linux OS. Please see below.
#########################
./check_traffic.sh -V 1 -C public -H 172.16.1.73 -L
List Interface for host 172.16.1.73.
Interface index 1 orresponding to lo
Interface index 2 orresponding to enP4p1s0f0
Interface index 3 orresponding to enP4p1s0f1
Interface index 4 orresponding to eth1
Interface index 5 orresponding to eth2
Interface index 6 orresponding to virbr0
Interface index 7 orresponding to virbr0-nic
#########################
Please Guide.
Nishith N.Vyas
Owner's reply
./check_traffic.sh -V 1 -C nocgnr -H 172.16.1.105 -I 2,
or
./check_traffic.sh -V 1 -C nocgnr -H 172.16.1.105 -N eth0
You can get the full usage at: https://github.com/cloved/check_traffic/blob/master/README.md
bynishith, February 23, 2016
./check_iis 172.16.1.105
currentAnonymousUsers 0,maxAnonymousUsers 4,currentConnections 0,maxConnections 98,|'currentAnonymousUsers'=0 'maxAnonymousUsers'=4 'currentConnections'=0
But, configuring the same in nagios configuration gives below error.
SNMP error, plugin missing?
Really don't know how to make it worked...!?
Page 1 of 2


