
Search Exchange
Search All Sites
Nagios Live Webinars
Let our experts show you how Nagios can help your organization.Login
 New Listings
Directory Tree
Directory
john12
byjohn12, June 2, 2015
This plugin is indeed superb.
I found a bug that when using unit=MB for disk usage, the perf data writtens only KB.
So to fix, i made changes on line no. 378 from
$perfdata .= " $mountpoint=$usage$o_unit";
To
$perfdata .= " $mountpoint=$tmpusage$o_unit;;;0;$tmptotal";
Addition $tmptotal in perf data will set the max MB in the graph.
Let me know,
regards,
John.
Owner's reply
Hello,
thanks for your comment,
Ussue fixed on v1.5
byjohn12, August 21, 2013
Hi,
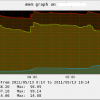
It would be nice to have total number of processes graph. Is it possible.
Thanks.
It would be nice to have total number of processes graph. Is it possible.
Thanks.
Owner's reply
Hi,
I just add this feature.


