
Search Exchange
Search All Sites
Nagios Live Webinars
Let our experts show you how Nagios can help your organization.Login
 New Listings
Directory Tree
IPMI Sensor Monitoring Plugin Featured Popular
Current Version
3.9
Last Release Date
2015-06-24
Compatible With
- Nagios 3.x
Owner
Download URL
License
GPL
Hits
1070756
Files:
| File | Description |
|---|---|
| check_ipmi_sensor_v3-v3.9.tar.gz | check_ipmi_sensor_v3-v3.9.tar.gz |


Version 3.x (Perl-based) and 2.x (Bash-skript) of the plugin are based on ipmimonitoring (FreeIPMI). They monitors both IPMI sensor classes (threshold and discrete). The older version 1.x (not maintained anymore) is based on ipmitool and can only monitor threshold based sensors.
There are three mailinglists regarding the plugin:
* http://lists.thomas-krenn.com/cgi-bin/mailman/listinfo/ipmi-plugin-announce (Announcements of new releases and critical security updates (list is moderated).)
* http://lists.thomas-krenn.com/cgi-bin/mailman/listinfo/ipmi-plugin-dev (Development discussions about the plugin.)
* http://lists.thomas-krenn.com/cgi-bin/mailman/listinfo/ipmi-plugin-user (General discussions regarding all issues and questions about the plugin.)
Reviews (7)
bykubik256, March 15, 2017
Plugin is excellent! Many thanks.
Little hint for somebody who get status critical on HP iLO IPMI, it will be something like: Critical [64 system event log (SEL) entries present]
SEL log can be cleared directly from Nagios host this way:
1) install ipmiutil (this way for ubuntu/debian)
apt-get install ipmiutil
2) run clear for HP iLO specified by iLO's IP address:
ipmiutil sel -d -V 4 -N -U -P -F HP
Hope this can save some time "googling" around ;)
Good plugin, and work great with Centreon in my case.
In my case, I use IPMIv2 and need to add the option "-D lan_2_0" to impi-sensors.
Test command is /usr/sbin/ipmi-sensors -h 10.1.1.1 -u monitoring -p password -l USER -D lan_2_0
And for the plugin :
#./check_ipmi_sensor -H 10.1.1.1 -U monitoring -P password -L USER -O '-D lan_2_0'
Works with this centreon command :
$USER1$/custom/check_ipmi_sensor -H $HOSTADDRESS$ -U $ARG1$ -P $ARG2$ -L USER -O '-D lan_2_0'
But the output of this perl script is not good for graph the differents sensors in Centreon. Maybe I work on this later and post it here.
Regards,
Belgotux
We're using this plugin to monitor SuperMicro and Dell C6100 hardware on CentOS 5 and Scientific Linux 6. Works great, very easy to set up.
bymtrento, August 3, 2012
hello
thank you for creating this plugin.
i tested the plugin on a ibm x3550 M4 and i get a critical alert stating :
IPMI Status : Critical [DASD Backplane 2 = Critical]
ibm says :
Drive drive has reported a fault. This event must be cleared manually.
http://pic.dhe.ibm.com/infocenter/director/v5r2/index.jsp?topic=/diricinfo_5.20/fqm0_r_events_cim_system.html
i cleared all events in the megaraidcli but still have the message.
ipmimonitoring command says
Dasd backplane 2 entity presence critical , entity Absent
i do not see other events in the ibm managment interface. And there is no alert led
do you have some clues?
Regards
byahmedali, July 10, 2011
hello,
I setup the plugin and it's needed software as following and it give me some error messages
I install freeipmi v 1.0.5 on the remote server then download the plugin v 2.2, move it to /usr/local/nagios/libexec/
#chown nagios:nagios /usr/local/nagios/libexec/check_ipmi_sensor
then test the tool
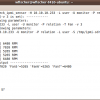
#ipmi-sensors -h localhost -u monitoring -p relation -l user
and it work then test the plugin from the server it self and it work # /usr/local/nagios/libexec/check_ipmi_sensor -H localhost -U monitoring -P relation -L user
then I install the freeipmi in a local machine to test the remote machine
ipmi-sensors -h remote-host-ip -u monitoring -p relation -l user
it give me ipmi-sensors: connection timeout
then when I try to test it from nagios using # /usr/local/nagios/libexec/check_nrpe -H remote-ip -c check_ipmi_sensor -a '-H localhost -U monitoring -P relation -L user'
it give me this error
/usr/local/sbin/ipmi-sensors: permission denied
-> Execution of ipmimonitoring failed with return code 1.
-> ipmimonitoring was executed with the following parameters:
/usr/local/sbin/ipmimonitoring -h 127.0.0.1 -u monitoring -p relation -l user --quiet-cache --sdr-cache-recreate
or this
sudo: sorry, you must have a tty to run sudo
-> Execution of ipmimonitoring failed with return code 1.
-> ipmimonitoring was executed with the following parameters:
sudo /usr/local/sbin/ipmimonitoring --quiet-cache --sdr-cache-recreate
thanks and best regards
I setup the plugin and it's needed software as following and it give me some error messages
I install freeipmi v 1.0.5 on the remote server then download the plugin v 2.2, move it to /usr/local/nagios/libexec/
#chown nagios:nagios /usr/local/nagios/libexec/check_ipmi_sensor
then test the tool
#ipmi-sensors -h localhost -u monitoring -p relation -l user
and it work then test the plugin from the server it self and it work # /usr/local/nagios/libexec/check_ipmi_sensor -H localhost -U monitoring -P relation -L user
then I install the freeipmi in a local machine to test the remote machine
ipmi-sensors -h remote-host-ip -u monitoring -p relation -l user
it give me ipmi-sensors: connection timeout
then when I try to test it from nagios using # /usr/local/nagios/libexec/check_nrpe -H remote-ip -c check_ipmi_sensor -a '-H localhost -U monitoring -P relation -L user'
it give me this error
/usr/local/sbin/ipmi-sensors: permission denied
-> Execution of ipmimonitoring failed with return code 1.
-> ipmimonitoring was executed with the following parameters:
/usr/local/sbin/ipmimonitoring -h 127.0.0.1 -u monitoring -p relation -l user --quiet-cache --sdr-cache-recreate
or this
sudo: sorry, you must have a tty to run sudo
-> Execution of ipmimonitoring failed with return code 1.
-> ipmimonitoring was executed with the following parameters:
sudo /usr/local/sbin/ipmimonitoring --quiet-cache --sdr-cache-recreate
thanks and best regards
bywernerfischer, June 17, 2010
0 of 1 people found this review helpful
Hi mj0ne,
thanks for your valuable feedback. The current version 1.2.1 of the plugin supports password files and also ignores 'ns' states.
I added these features in version 1.2:
http://lists.thomas-krenn.com/pipermail/ipmi-plugin-announce/2010-June/000001.html
The current version is 1.2.1:
http://lists.thomas-krenn.com/pipermail/ipmi-plugin-announce/2010-June/000002.html
Feedback regarding the plugin is always welcome! I created two mailinglists:
* http://lists.thomas-krenn.com/cgi-bin/mailman/listinfo/ipmi-plugin-announce
* http://lists.thomas-krenn.com/cgi-bin/mailman/listinfo/ipmi-plugin-user
Subscribe to ipmi-plugin-announce if you use the plugin and want to get notified whenever there is an updated version.
Subscribe to ipmi-plugin-user if you want send questions and follow current discussions.
Best regards,
Werner (author of the plugin)
Good work in this one, ability to use verbose output(-v1/2/3) to get more data and to use graphs. Author have a nice site for that to.
Missing -f option for password file, but it's coming in later version.
Im missing nagios status control for the diffrent IPMI outputs.
ns(Disable) and ns(No Reading), is still okey on most IPMI clients. Need fixing. They return warning output(nagios status 1).
Site is in germany. Luckly I use google for translation. http://translate.google.com/translate?js=y&prev=_t&hl=en&ie=UTF-8&layout=1&eotf=1&u=http%3A%2F%2Fwww.thomas-krenn.com%2Fde%2Fwiki%2FIPMI_Sensor_Monitoring_Plugin&sl=de&tl=en


