
Search Exchange
Search All Sites
Nagios Live Webinars
Let our experts show you how Nagios can help your organization.Login
 New Listings
Directory Tree
check_cputime
Current Version
1.0
Compatible With
- Nagios 1.x
- Nagios 2.x
- Nagios 3.x
- Nagios 4.x
- Nagios XI
Owner
Hits
18053
Files:
| File | Description |
|---|---|
| check_cputime.sh | check_cputime plugin file |


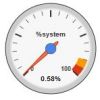
This plugin is created so that 'Performance Gauges' in Nagios XI work properly, showing appropriate 'Warning' and 'Critical' regions.
For Performance Gauges to show details properly, performance data should be in following format:
'VarName'=CurrentValue Unit;WarningValue;CriticalValue;MininumValue;MaximumValue
Important:
1. It uses the output of 'sar' command.
2. Warning and Critical thresholds are 80% and 90% for %user, %system, % nice, %iowait and %steal time.
3. Warning and Critical thresholds for %idle time makes no sense.
How To Use:
To monitor remote Linux server:
1. Keep the plugin in /usr/local/nagios/libexec directory.
2. Add following line to the nrpe.cfg file:
command[check_cputime.sh]=sudo /usr/local/nagios/libexec/check_cputime.sh
3. Add the following line to /etc/sudoers file:
nagios ALL=(ALL) NOPASSWD:/usr/local/nagios/libexec/check_cputime.sh
Usage:
On Monitoring Server:
./check_nrpe -H 128.9.45.13 -c check_cputime.sh
Output:
OK- %user=8.03%, %nice=0.00%, %system=21.07%, %iowait=0.00%, %steal=0.00%, %idle=70.90% | '%user'=8.03%;80;90;0;100 '%nice'=0.00%;80;90;0;100 '%system'=21.07%;80;90;0;100 '%iowait'=0.00%;80;90;0;100 '%steal'=0.00%;80;90;0;100 %idle=70.90%;;;0;100
Reviews (0)
Be the first to review this listing!


