
Search Exchange
Search All Sites
Nagios Live Webinars
Let our experts show you how Nagios can help your organization.Login
 New Listings
Directory Tree
Status Info Dashlet
Current Version
2016-08-22
Last Release Date
2016-08-22
Compatible With
- Nagios XI
Owner
License
GPL
Hits
75091
Files:
| File | Description |
|---|---|
| statusinfo.zip | Status Info Dashlet |


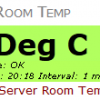
For example, you want to watch the free space check on a particular server (it's been fluctuating recently for no reason).
This Dashlet allows you to take the current output for the free space check and display that in nice big numbers on your own dashboard!
This ONLY works with Nagios XI.
Upload the Dashlet via Admin > Manage Dashlets.
Create your custom Dashlet via Dashboards > Available Dashlets. This will bring up the "Add To Dashboard" window.
Please refer to the Help tab when viewing the "Add To Dashboard" window for all questions / troubleshooting.
NOTE: Internet Explorer Compatability View Issues
The "Add To Dashlet" window does not appear correctly when Compatability View is ON.
All feedback is welcome, your input can help improve this product.
Version History
2012-07-22 Initial release.
* Tested on Nagios XI 2011R2.4
2013-01-20
* Tested on Nagios XI 2012R1.4
* Major code overhaul
* Dashlet refresh functionality implemented
* You choose how often the dashlet will refresh
* For Dashlets that were created BEFORE refresh functionality was introduced, a default refresh interval of 7 minutes will be used
* Dashlets that were created BEFORE this version will continue to work
* Changed Current State default Text Color from Gray to Black
* Changed Current State default Text Size from X Small to Small
* Removing 'UP - ' did not work in Preview - fixed
* Removing 'DOWN - ' did not work after Dashlet was added - fixed
2013-01-29
* Fixed bug where 'statusinfo-' was being added to the beginning of the Text field
2013-01-31
* Fixed bug where the Last Refresh text was not being styled if the "Show Current State" option was not selected.
2013-07-23
* Updated dashlet to display a message if the service object cannot be found.
2015-03-21
* Dashlet optimized to be used with the XI User Interface theme "XI 2014"
* Tested on Nagios XI 2014R2.6
2015-11-24
* Fixed some code to prevent errors from appearing in apache error_log
* Fixed CSS to work in Nagios XI 5
* Tested on Nagios XI 5.2.2
2015-12-02
* Adjusted desciption so it displays better with versions greater than Nagios XI 5.2.2.
2015-12-18
* Fixed bug where unchecking option #15 did not work in dashlet, reported by Charles Bushbaum.
2016-04-08
* Fixed bug where sometimes it reports 'Cannot find the service object " - "', reported by Christian Hill and Michael Herring.
* Updated so dashlet appears correctly under "Available Dashlets" in XI 5.x
* Dashlets can now have a link that takes you to the Service Status Detail page in a new tab
* Dashlets can now have rounded corners for the sections with background color
* List of services are now sorted alphabetically
* Larger font sizes
2016-08-22
* Fixed bug where option 14 "Remove characters from the beginning of the object status output" was not working when the custom text contained a forward slash, reported by Steven Elliott
* Fixed bug where option 11 "Show the current status underneath the object (as text)" does not work when unchecked, reported by Steven Elliott
* Fixed some code to prevent errors from appearing in apache error_log
Reviews (2)
byssax, March 15, 2021
You can run this command to fix the PHP 7 issue with split on line 166 (should be explode in PHP 7+):
sed -i 's/split(/explode(/g' /usr/local/nagiosxi/html/includes/dashlets/statusinfo/statusinfo_inboard.php?
sed -i 's/split(/explode(/g' /usr/local/nagiosxi/html/includes/dashlets/statusinfo/statusinfo_inboard.php?
bymherring, April 7, 2016
This dashlet is brilliant. By far one of the most logical dashlet to have. I was looking for a way to display our Enterprise Bandwidth usage across our WAN and this dashlet is what I need. The only suggestion I would like to make is maybe to incorporate the Associated Graph with the service check.
The owner of this Dashlet is great to work with. I had an issue and contacted the owner and within 12 hours I had a response and we worked through the issue to get it resolved. I couldn't have asked for better service.
The owner of this Dashlet is great to work with. I had an issue and contacted the owner and within 12 hours I had a response and we worked through the issue to get it resolved. I couldn't have asked for better service.


